Content presented here focuses exclusively on legitimate financial planning education, aiming to improve understanding of concepts, methodologies, and analytical approaches without promoting any specific securities, strategies, or market participation decisions.
No Personalized Advice:
No personalized recommendations, solicitations, or assurances are provided, and no guarantees of future performance, outcomes, or returns are implied, expressed, or otherwise suggested under any circumstances within this educational material.
Data Limitations:
Uploaded results rely on deterministic, offline data because live data was unavailable within the sandbox environment, and therefore outputs should be interpreted as illustrative examples rather than real time analyses.
Long-Only Scope:
All research language used is long only, avoiding options, puts, short selling, or bearish strategies, ensuring the discussion remains focused on traditional asset ownership and positive directional exposure concepts overall.
Turn Strategy Rankings Into Trader Review Records
A ranked AMZN strategy table is only the start of the conversation. This article focuses on the review record that should sit behind each ranking: what the rule tried to capture, how often it traded, how much drawdown it required, how the win rate should be interpreted, and what lesson the trader should carry into the next research cycle.
The articles do not recommend buying, selling, or holding Amazon. This part uses strategy records as educational review evidence, not as allocation guidance.
Positioning
The trader voice in part 3 is the reviewer after the run has completed. The article is less about building the engine and more about reading the records with discipline: return, Sharpe, drawdown, trade count, win rate, turnover burden, and whether the rule's behavior matches its stated purpose.
The Client Problem Worth Solving
Teams often overreact to rankings. The highest-return row can hide difficult drawdowns, while a lower-return row can teach useful lessons about turnover, signal timing, or defensive behavior. A trader review record keeps each strategy from becoming either a trophy or a discard pile too quickly.
Business Outcomes This Workflow Supports
The workflow supports better post-run review. It helps portfolio teams compare strategy personalities, helps risk teams challenge drawdown before return, helps governance teams confirm the data boundary, and helps committees avoid treating a ranked table as a decision engine.
Table Of Contents
Part 1: Institutional Opening And Trading Voice — Establishes the institutional trading voice, AMZN position context, communication discipline, and education-only framing.
Part 2: Business Problem And Position Discipline — Defines why profitable long positions still require evidence-based entry, exit, sizing, drawdown, benchmark, and audit controls.
Part 3: AgentCore And Strands Architecture — Explains bounded agent roles, controlled tools, logged outputs, and human review boundaries for financial-services research.
Part 4: Trader Review Records And Result Interpretation — Maps trader-review records, result interpretation, code-path controls, signal/execution separation, and committee challenge points.
Part 5: Strategy Lessons, Drawdown, And Committee Evidence — Reviews strategy lessons through return, volatility, Sharpe, drawdown, trade count, win rate, ledger quality, and operational feasibility.
Part 6: Executive Close And Governance Review — Converts charts, ledgers, and results into committee language while preserving human accountability and education-only boundaries.
Part 7: Trader Review Standards And Governance Lenses — Groups the trader-review standard, committee evidence pack, drawdown communication, ranking limits, and governance lenses for cleaner reading.
Part 8: Agentic Operating Model And Result Table — Separates the series focus, AgentCore and Strands operating model, and full strategy-result table into one evidence-review section.
Part 9: Crossover, Risk Filter, And Recovery Strategy Records — Collects GoldenCross, DowRiskFilter, RateOfChange, EMACross, and RSIRecovery records into one strategy-review section.
Part 10: Trading Lessons, Source Notes, And Governance Close — Finishes with trading lessons, source and evidence notes, committee close narrative, and final governance checklist.
Part 1: Institutional Opening And Trading Voice
Related summary: Establishes the institutional trading voice, AMZN position context, and communication discipline. It frames the article as education and planning support, not investment advice, recommendation, solicitation, or a promise of future returns.
The opening should not celebrate a position before it explains the control problem. A strong AMZN gain can create confidence, but confidence is not a substitute for entry discipline, exit discipline, sizing logic, drawdown tolerance, and benchmark-relative review.
The useful practice-note message is absorbed here as speaking discipline: use evidence language, state the data mode, name the assumptions, and avoid promising certainty. The article should read like institutional research, not like a promotional pitch.
Part 2: Business Problem And Position Discipline
Related summary: Defines why profitable long positions still require evidence-based entry, exit, sizing, drawdown, and benchmark controls. It connects portfolio management, risk oversight, technology governance, and audit requirements into one reviewable workflow.
The business problem is fragmented evidence. Portfolio teams want speed, risk teams want traceability, technology teams want secure orchestration, and compliance teams want appropriate language. The workflow aligns those needs by creating a repeatable research path.
Position discipline means every strategy should answer the same questions: why enter, why exit, how much exposure, what cost assumption, what drawdown path, and what benchmark context. Those questions are now part of the main article body rather than a note at the end.
Part 3: AgentCore And Strands Architecture
Related summary: Explains the agentic architecture by separating orchestrator, data agent, strategy agent, backtest tool, risk reviewer, and governance checker. Each component has bounded authority, controlled tools, and logged outputs for financial-services review.
The architecture in this article is viewed from the review desk. The Quant Orchestrator records the request, the engine produces the ledger, the Risk Review Agent reads the ranking table, and the Governance Agent makes sure the trader review stays educational, long-only, and bounded by the demo-data limitation.
Agent governance means bounded authority. The agent can prepare evidence, but it cannot decide suitability, guarantee returns, or replace the investment committee. Logs and artifacts make the workflow challengeable.
Part 4: Trader Review Records And Result Interpretation
Related summary: Explains the article-specific engine path, code talk, strategy logic, and review controls. The section converts implementation details into trader language that can be challenged by risk, technology, and governance stakeholders.
The code path should be explained as a control map. Inputs feed indicators, indicators create entry and exit signals, the engine simulates orders, costs are applied, the ledger is written, and metrics summarize the path. That sequence replaces line-by-line recital with business-readable logic.
Signal logic and execution logic should remain separate. A signal may say conditions are favorable, but the engine must still check cash, position state, commission, risk exits, and ledger updates. This separation improves review quality.
This article focuses on trader review, committee records, crossover signals, recovery strategies, and lessons learned. The reader should evaluate whether the code path makes those controls visible enough for a committee, risk reviewer, or technology owner to challenge.
Part 5: Strategy Lessons, Drawdown, And Committee Evidence
Related summary: Reviews strategy records and lessons learned through return, volatility, Sharpe, drawdown, trade count, win rate, ledger quality, and operational feasibility. The section treats demo results as workflow evidence, not real market advice.
Strategy records should not be read as recommendations. They are evidence for comparing rule behavior, trade frequency, drawdown profile, and explainability. The numbers are especially limited when the data mode is deterministic offline demo data.
Lessons learned should be specific. A high-return strategy may have uncomfortable drawdown. A low-turnover strategy may be easier to govern. A high-trade-count strategy may create decision fatigue, slippage exposure, and operational burden.
Part 6: Executive Close And Governance Review
Related summary: Turns code, charts, and ledgers into committee language: what was tested, what improved, what failed, what remains uncertain, and why human judgment remains the final control before any production or allocation decision.
The close should translate research into governance language. The committee needs to know what was tested, what evidence was generated, which assumptions matter, what failed, and what remains a human decision.
A responsible close avoids victory language. It says that agents can help document assumptions, run repeatable tests, compare behavior, and prepare better reviews, while human judgment remains the final control.
Part 7: Trader Review Standards And Governance Lenses
Related summary: Groups the trader-review standard, committee evidence pack, drawdown communication, ranking limits, and governance lenses for cleaner reading.
Integrated Main-Article Detail 1: Trader Review Standard
A trader review should state what worked, what failed, and what remains unknown. The phrase “useful, but not sufficient” keeps the discussion disciplined and avoids turning demo output into allocation advice.
The committee evidence pack should contain strategy description, data mode, key metrics, drawdown, trade count, win rate, ledger availability, limitations, and a clear next-step recommendation for research only.
Integrated Main-Article Detail 3: Drawdown Communication
Drawdown should be discussed before return because it describes the path a trader must live through. A strategy with attractive return can still be unsuitable if the stress path is unacceptable.
Integrated Main-Article Detail 4: Result Ranking Limits
A ranked result table is a starting point, not a decision engine. Higher return, higher Sharpe, lower turnover, and lower drawdown can point to different strategy personalities and different mandate fits.
Governance Review Lens 1: Evidence Before Opinion
The research narrative should first identify data mode, rule logic, assumptions, costs, drawdown, and ledger availability. Opinion comes after evidence, not before it.
Governance Review Lens 2: Demo Data Boundary
When results come from offline deterministic demo data, the article should say so in the main body. Demo records are useful for workflow education and review design, not for making a real allocation decision.
Governance Review Lens 3: Ledger As Desk Memory
A trade ledger is the desk memory system. It shows when positions opened, when they closed, what size was used, which signal fired, and whether the process respected risk rules.
Governance Review Lens 4: Failure Mode Review
Professional readers should see failure modes before conclusions. Trend rules can whipsaw, recovery rules can miss persistent weakness, and active signals can create turnover that looks cleaner in a notebook than on a desk.
Governance Review Lens 5: Human Accountability
Agentic tools can gather, run, summarize, and organize, but the portfolio owner remains responsible for mandate fit, suitability, risk tolerance, and final judgment.
Part 8: Agentic Operating Model And Result Table
Related summary: Separates the series focus, AgentCore and Strands operating model, and full strategy-result table into one evidence-review section.
Series Focus
This post is part 3 of four and concentrates on trader review, committee records, crossover signals, and recovery strategies. It uses Bedrock AgentCore and Strands Agents as the agentic operating model, the uploaded custom Cerebro-style engine as the code foundation, and the strategy summary records as the performance-review evidence. The discussion is educational, not a recommendation.
Bedrock AgentCore And Strands Agents Operating Model
The production design separates five responsibilities. The Quant Orchestrator receives the research request and decomposes it into data, strategy, execution, risk, and governance tasks. The Market Data Agent retrieves or validates AMZN and benchmark data. The Strategy Agent produces entry and exit signals. The Backtest Engine Tool runs the custom Cerebro-style simulation. The Risk Review Agent reads the trade ledger, performance metrics, and charts. The Governance Agent checks disclosures, long-only policy, data provenance, and suitability language.
AgentCore Runtime is the secure hosting layer for agents and tools, while Strands Agents provides a programming model for tool calling, orchestration, and agent behavior. In a regulated FSI environment, the agent should not directly approve a trade. It should create evidence, highlight uncertainty, and route outputs to human review.
A practical AWS data layer supports this review article by making records comparable. The committee should be able to open the summary table, the individual ledger, the chart artifact, and the exception notes for the same run identifier before accepting any lesson learned.
Strategy Result And Performance Review
The uploaded summary ranks twenty custom-engine strategies by total return, annual return, volatility, Sharpe, maximum drawdown, trade count, and win rate. The uploaded manifest identifies the engine as CustomCerebroEngine, shows strategy count of twenty and image count of twenty-two, and states the rules: long-only, no options, no puts, and no shorts.
The table below is a trader's record, not investment advice. Because the manifest states that the data mode is deterministic offline demo data, the numbers are useful for explaining workflow and code logic, not for making a real allocation decision. In production, the same workflow should be rerun against validated real AMZN and benchmark data.
Rank
Strategy
Total Return
Annual Return
Volatility
Sharpe
Max Drawdown
Trades
Win Rate
1
IchimokuLongStrategy
1430.60%
14.08%
12.33%
1.14
-22.43%
53
47.17%
2
DonchianTrendStrategy
921.18%
11.87%
11.43%
1.04
-24.64%
20
70.00%
3
ADXTrendStrategy
723.63%
10.72%
9.13%
1.17
-16.88%
116
51.72%
4
MultiFactorEnsembleStrategy
604.05%
9.88%
11.23%
0.88
-24.44%
143
33.57%
5
RelativeStrengthNDXStrategy
587.02%
9.75%
11.17%
0.87
-23.23%
135
45.19%
6
Breakout55Strategy
555.52%
9.50%
10.65%
0.89
-24.14%
27
59.26%
7
CCIMomentumStrategy
551.10%
9.47%
9.81%
0.96
-19.07%
115
49.57%
8
ParabolicSARStrategy
497.68%
9.01%
11.78%
0.76
-24.28%
357
25.77%
9
MACDTrendStrategy
430.40%
8.39%
10.69%
0.78
-26.60%
214
41.59%
10
MarketRegimeSPXStrategy
421.61%
8.30%
10.44%
0.79
-23.20%
167
32.34%
11
GoldenCrossStrategy
330.81%
7.31%
9.80%
0.75
-27.62%
10
70.00%
12
DowRiskFilterStrategy
181.18%
5.12%
8.78%
0.58
-19.07%
18
55.56%
13
RateOfChangeStrategy
161.42%
4.75%
9.56%
0.50
-44.62%
213
45.07%
14
EMACrossStrategy
143.43%
4.39%
8.61%
0.51
-17.57%
40
50.00%
15
RSIRecoveryStrategy
50.38%
1.99%
5.50%
0.36
-23.55%
18
72.22%
16
StochasticStrengthStrategy
28.78%
1.23%
8.70%
0.14
-27.95%
741
40.35%
17
KeltnerChannelStrategy
27.40%
1.18%
3.74%
0.31
-10.50%
13
69.23%
18
BollingerReversionStrategy
16.69%
0.75%
4.66%
0.16
-28.36%
46
71.74%
19
VolumeConfirmStrategy
5.95%
0.28%
1.87%
0.15
-12.46%
5
40.00%
20
ATRChannelStrategy
1.52%
0.07%
1.93%
0.04
-7.28%
3
66.67%
Part 9: Crossover, Risk Filter, And Recovery Strategy Records
Related summary: Collects GoldenCross, DowRiskFilter, RateOfChange, EMACross, and RSIRecovery records into one strategy-review section.
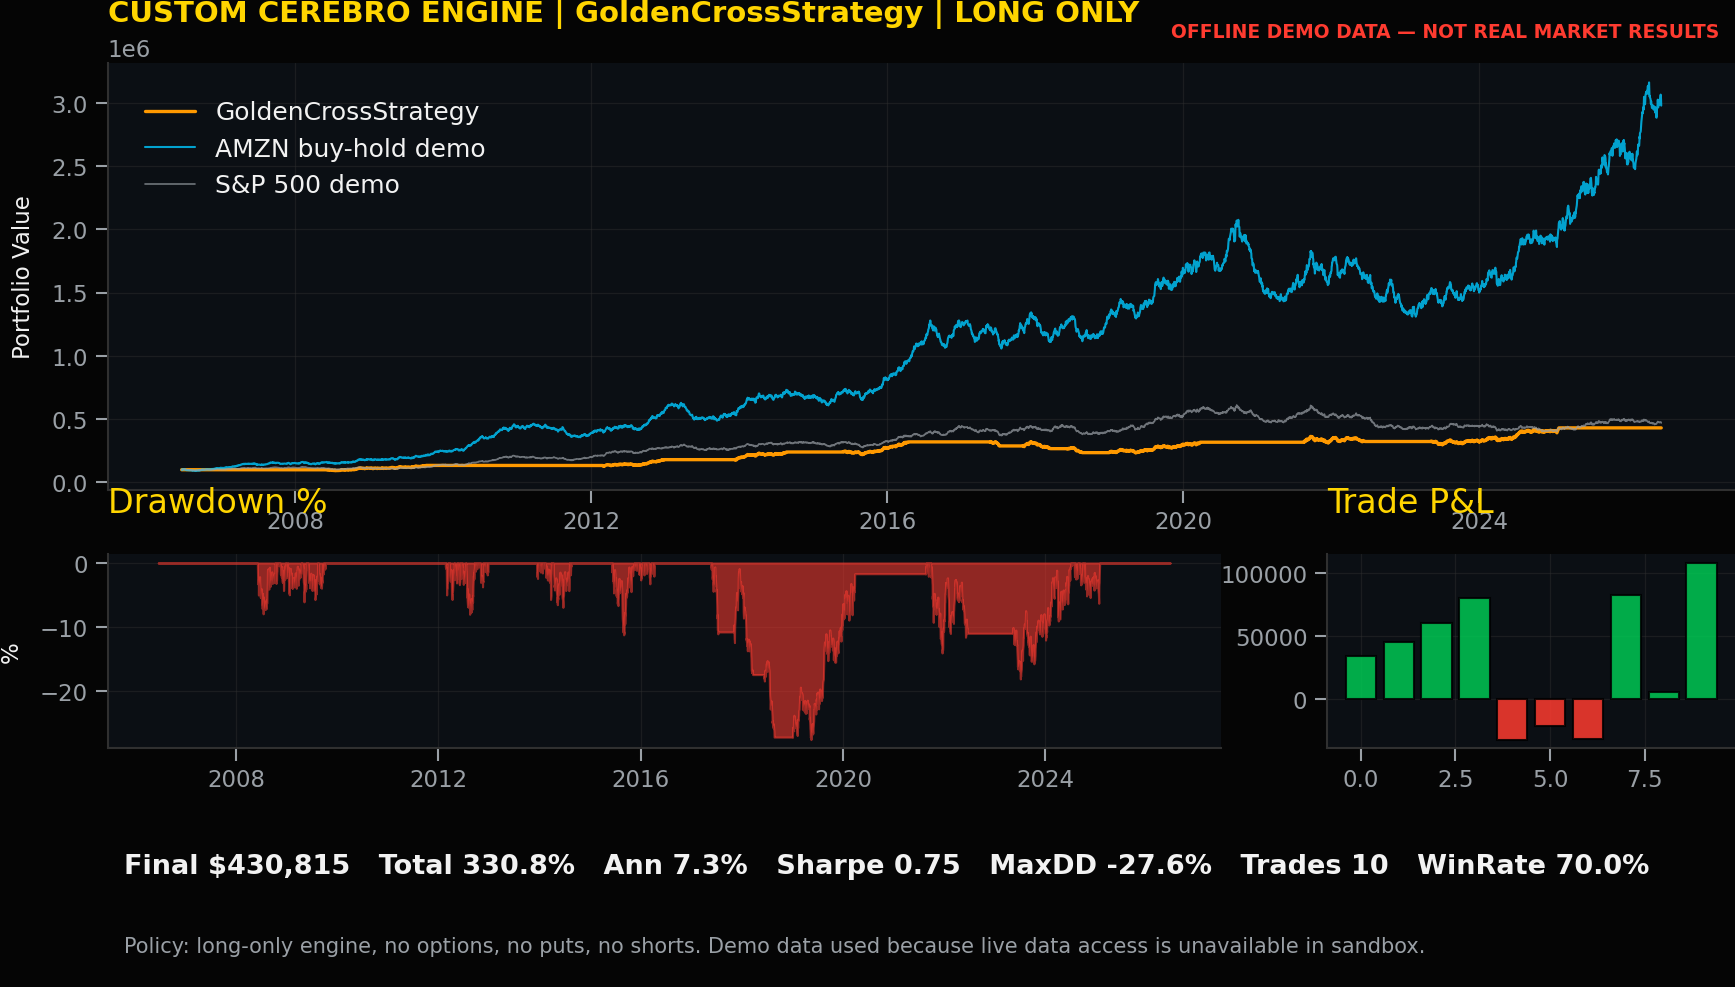
Strategy Record: GoldenCrossStrategy
Strategy Record: GoldenCrossStrategy
Code talk. GoldenCrossStrategy uses the classic 50/200 moving average crossover. For GoldenCrossStrategy, the signal definition should be reviewed separately from execution mechanics so the committee can distinguish market logic from order simulation, cost handling, and ledger production.
Performance review by trader. Total return was 330.81%, annual return was 7.31%, volatility was 9.80%, Sharpe was 0.75, maximum drawdown was -27.62%, trades were 10, and win rate was 70.00%. These numbers are uploaded custom-engine offline demo records, not real market results.
Trading record and lesson learned. The lesson for GoldenCrossStrategy is to use the record as a review prompt: inspect explainability, turnover, drawdown tolerance, cost sensitivity, and whether the rule adds position-management insight beyond the headline return.
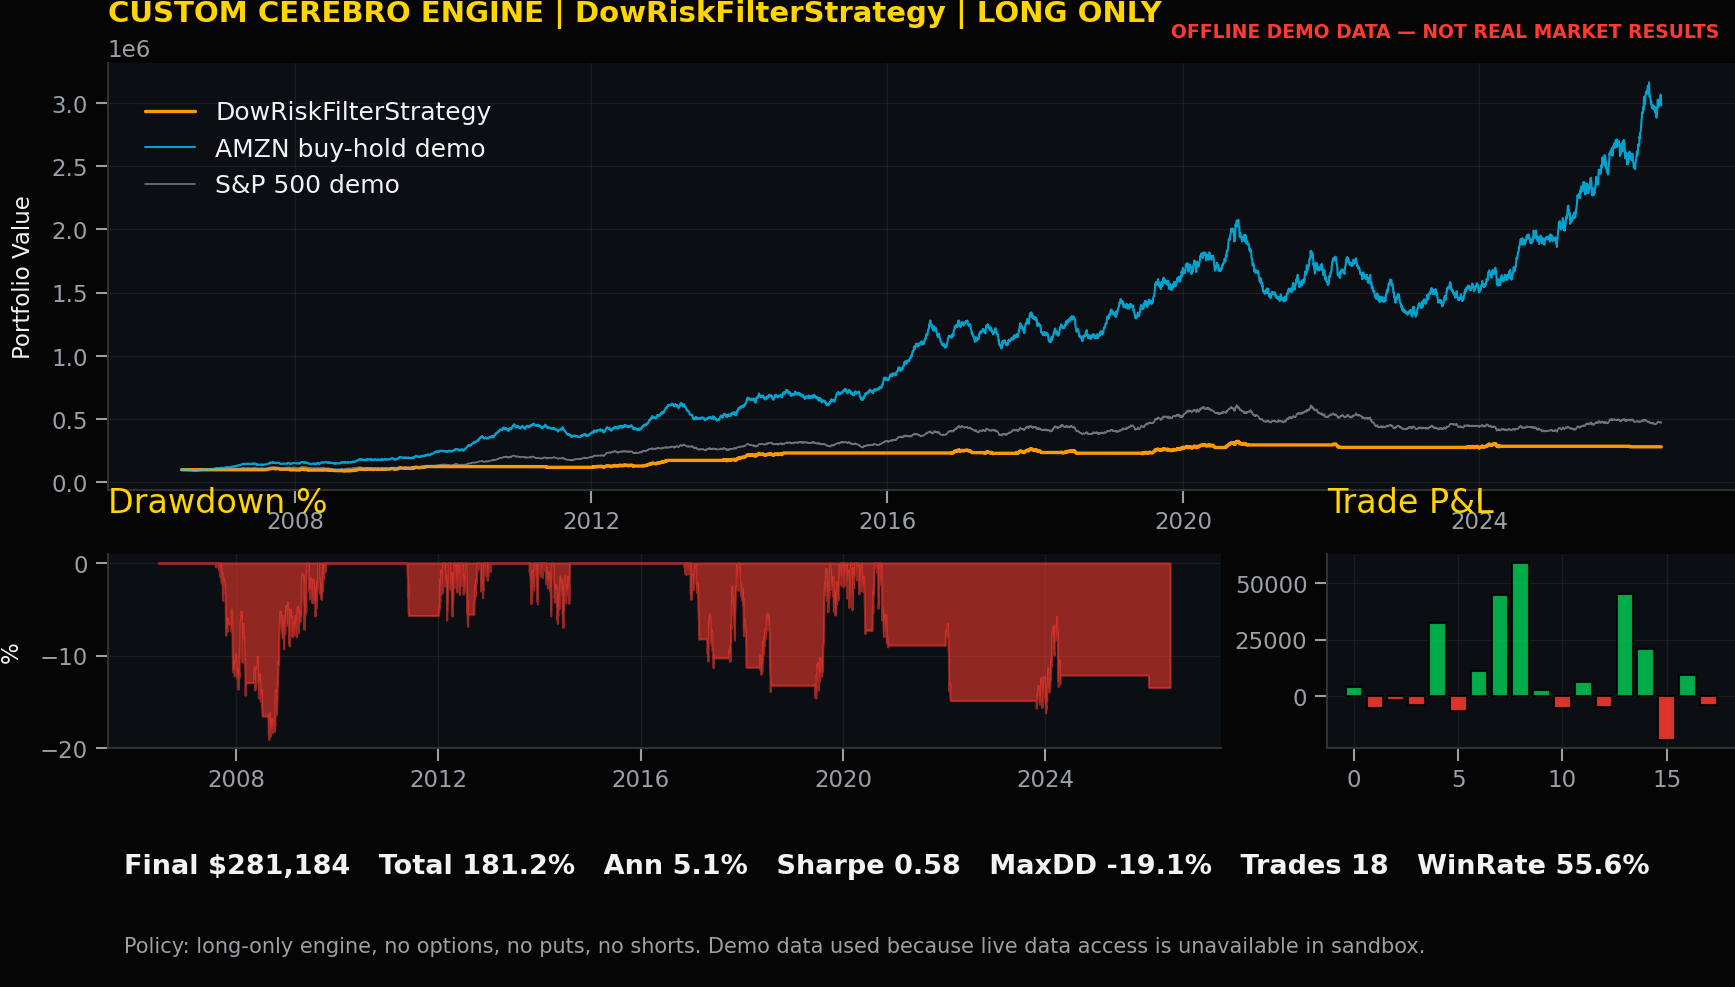
Strategy Record: DowRiskFilterStrategy
Strategy Record: DowRiskFilterStrategy
Code talk. DowRiskFilterStrategy combines Dow trend condition with AMZN fast and slow EMA cross. For DowRiskFilterStrategy, the signal definition should be reviewed separately from execution mechanics so the committee can distinguish market logic from order simulation, cost handling, and ledger production.
Performance review by trader. Total return was 181.18%, annual return was 5.12%, volatility was 8.78%, Sharpe was 0.58, maximum drawdown was -19.07%, trades were 18, and win rate was 55.56%. These numbers are uploaded custom-engine offline demo records, not real market results.
Trading record and lesson learned. The lesson for DowRiskFilterStrategy is to use the record as a review prompt: inspect explainability, turnover, drawdown tolerance, cost sensitivity, and whether the rule adds position-management insight beyond the headline return.
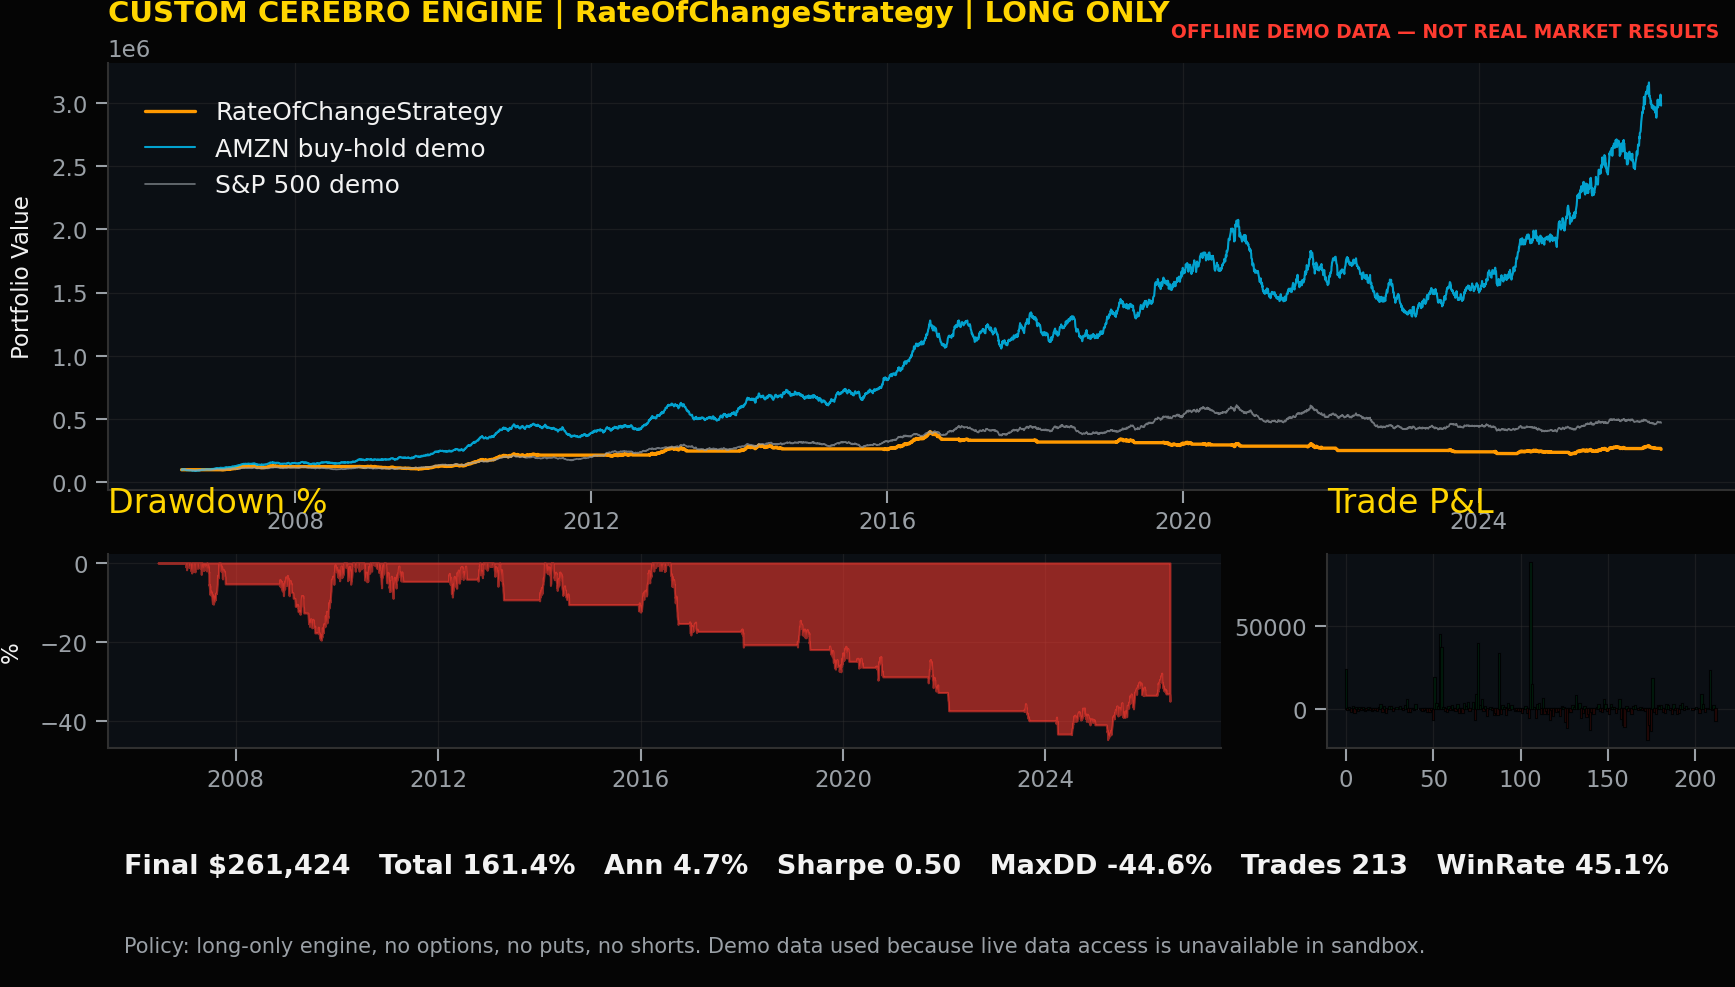
Strategy Record: RateOfChangeStrategy
Strategy Record: RateOfChangeStrategy
Code talk. RateOfChangeStrategy requires six-month rate-of-change above threshold and exits below medium average. For RateOfChangeStrategy, the signal definition should be reviewed separately from execution mechanics so the committee can distinguish market logic from order simulation, cost handling, and ledger production.
Performance review by trader. Total return was 161.42%, annual return was 4.75%, volatility was 9.56%, Sharpe was 0.50, maximum drawdown was -44.62%, trades were 213, and win rate was 45.07%. These numbers are uploaded custom-engine offline demo records, not real market results.
Trading record and lesson learned. The lesson for RateOfChangeStrategy is to use the record as a review prompt: inspect explainability, turnover, drawdown tolerance, cost sensitivity, and whether the rule adds position-management insight beyond the headline return.
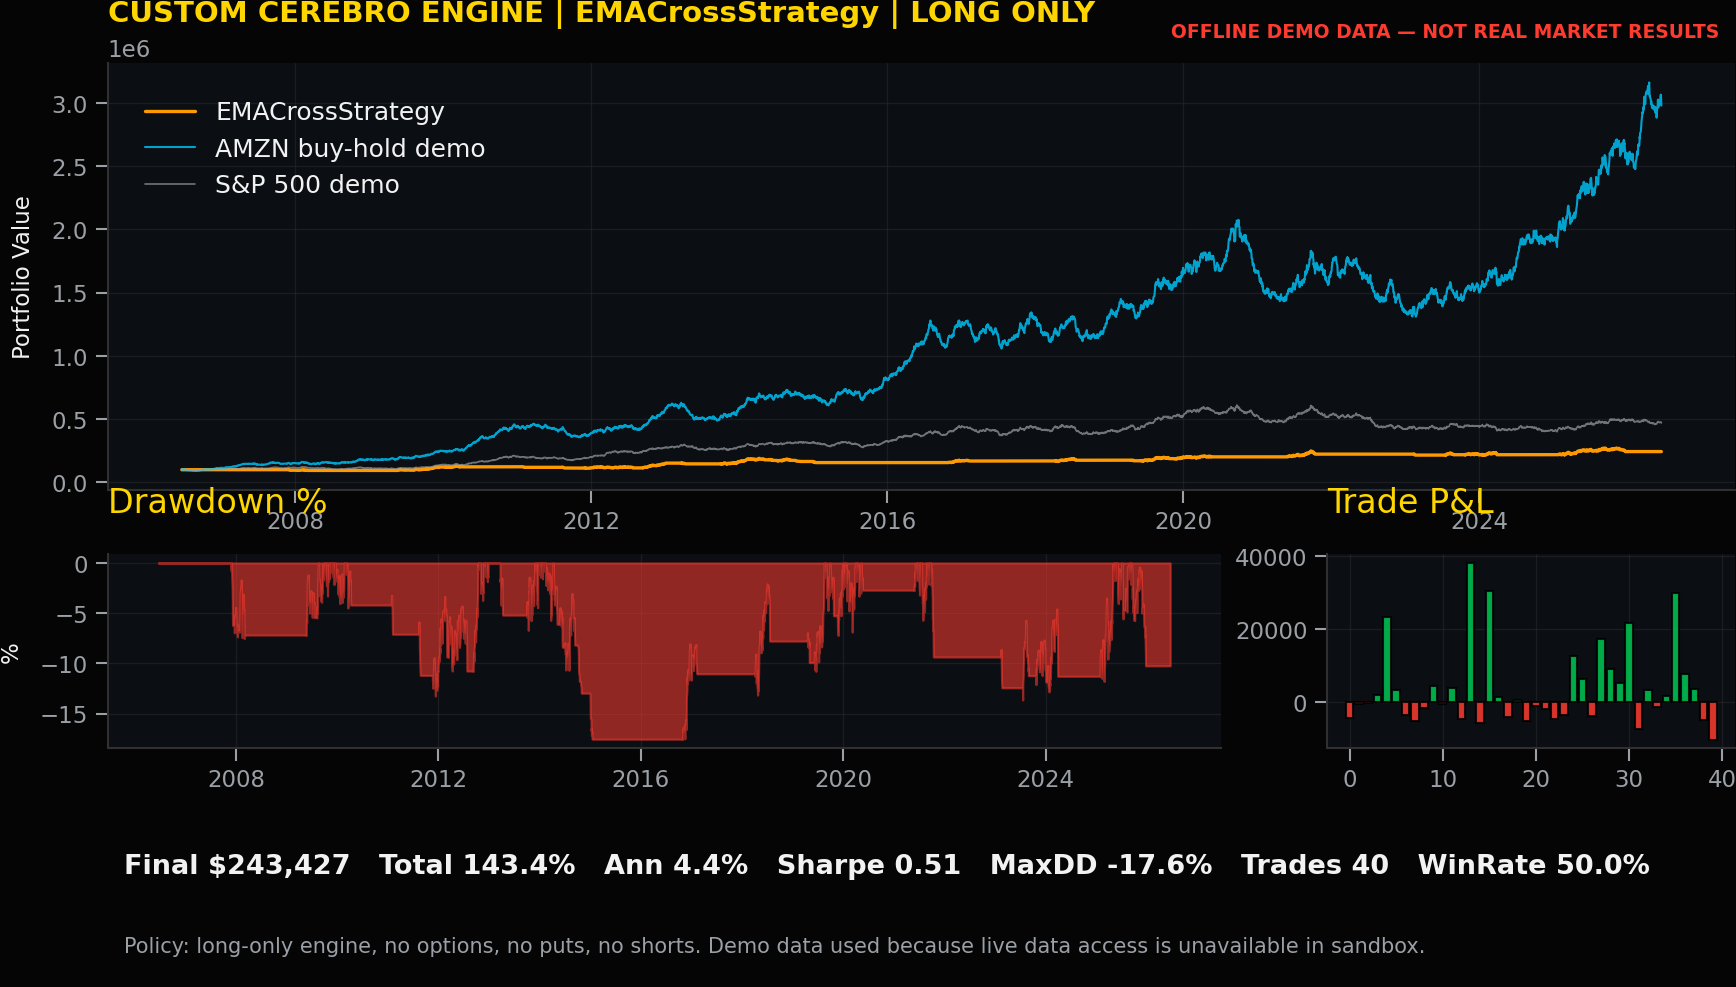
Strategy Record: EMACrossStrategy
Strategy Record: EMACrossStrategy
Code talk. EMACrossStrategy uses a responsive 10/30 EMA cross with S&P confirmation. For EMACrossStrategy, the signal definition should be reviewed separately from execution mechanics so the committee can distinguish market logic from order simulation, cost handling, and ledger production.
Performance review by trader. Total return was 143.43%, annual return was 4.39%, volatility was 8.61%, Sharpe was 0.51, maximum drawdown was -17.57%, trades were 40, and win rate was 50.00%. These numbers are uploaded custom-engine offline demo records, not real market results.
Trading record and lesson learned. The lesson for EMACrossStrategy is to use the record as a review prompt: inspect explainability, turnover, drawdown tolerance, cost sensitivity, and whether the rule adds position-management insight beyond the headline return.
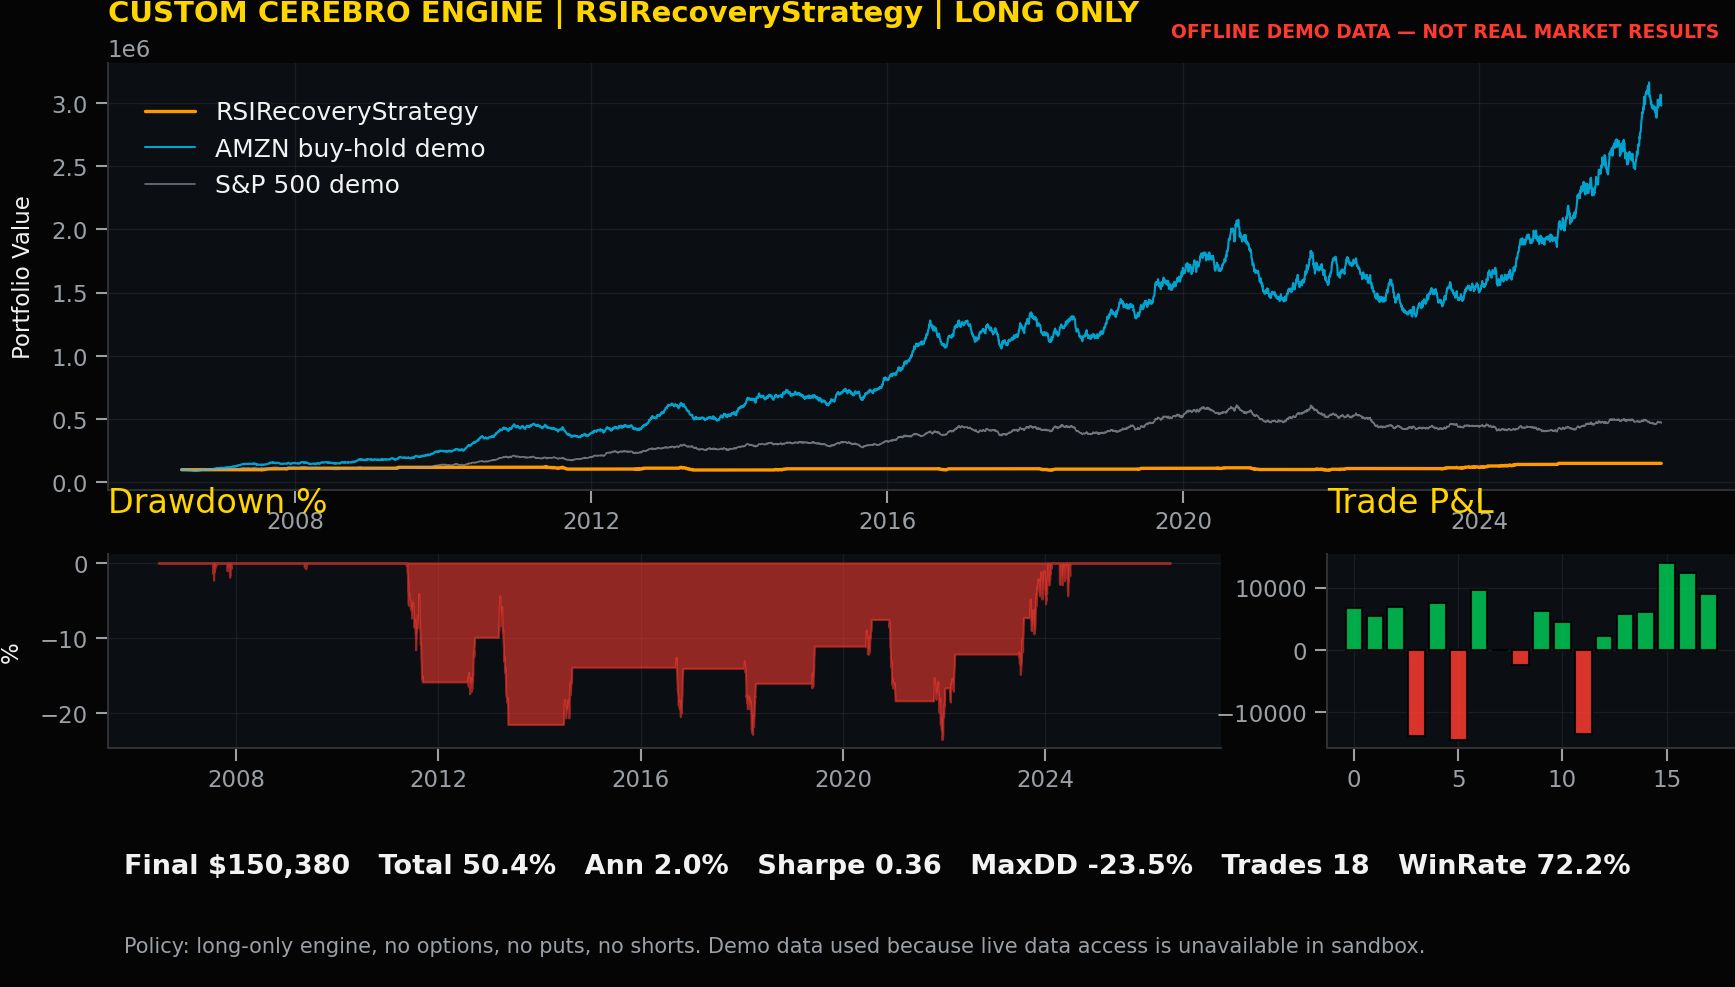
Strategy Record: RSIRecoveryStrategy
Strategy Record: RSIRecoveryStrategy
Code talk. RSIRecoveryStrategy buys RSI recovery from oversold while price remains above long-term trend. For RSIRecoveryStrategy, the signal definition should be reviewed separately from execution mechanics so the committee can distinguish market logic from order simulation, cost handling, and ledger production.
Performance review by trader. Total return was 50.38%, annual return was 1.99%, volatility was 5.50%, Sharpe was 0.36, maximum drawdown was -23.55%, trades were 18, and win rate was 72.22%. These numbers are uploaded custom-engine offline demo records, not real market results.
Trading record and lesson learned. The lesson for RSIRecoveryStrategy is to use the record as a review prompt: inspect explainability, turnover, drawdown tolerance, cost sensitivity, and whether the rule adds position-management insight beyond the headline return.
Part 10: Trading Lessons, Source Notes, And Governance Close
Related summary: Finishes with trading lessons, source and evidence notes, committee close narrative, and final governance checklist.
Trading Records And Lessons Learned
A trade record is more than a receipt. It is a memory system for the desk. Each entry date asks whether the trader had a repeatable signal or only a story. Each exit date asks whether the process respected risk or waited for emotion to negotiate. Each drawdown asks whether the sizing rule was honest about volatility.
The first lesson in the trader-review article is that rankings need interpretation. GoldenCrossStrategy, DowRiskFilterStrategy, RateOfChangeStrategy, EMACrossStrategy, and RSIRecoveryStrategy each show different tradeoffs between participation, patience, drawdown, and signal frequency.
The second lesson is that a review record should name what remains unknown. Demo metrics can identify strategy personality, but they do not settle real-data robustness, cost sensitivity, mandate fit, or future regime behavior.
The third lesson is that trader review should separate activity from insight. A strategy with many trades may reveal useful timing behavior, but the review record must show whether that activity improved risk-adjusted participation or merely created more decisions to defend.
Source And Evidence Notes
This article uses the uploaded custom engine artifacts as its performance discussion source. The manifest states that the engine is CustomCerebroEngine, the data mode is deterministic offline demo data, the strategy count is twenty, the image count is twenty-two, and the rules are long-only with no options, no puts, and no shorts. The strategy summary file ranks all twenty strategies by total return, annual return, volatility, Sharpe, maximum drawdown, trades, and win rate. The uploaded code file supplies the engine structure, indicator definitions, signal map, metrics function, and Bloomberg dark-mode chart generation approach.
External architecture references: Amazon Bedrock AgentCore documentation describes AgentCore as a managed service for deploying and operating agents securely at scale, and AgentCore Runtime as a secure serverless environment supporting frameworks such as Strands, LangGraph, and CrewAI. Strands documentation describes deploying Strands Agents to AgentCore Runtime and using Python integration patterns for agent entrypoints. Backtrader documentation is referenced conceptually for the Cerebro pattern of gathering data feeds, strategies, analyzers, observers, and plotting facilities.
Committee Close Narrative
Here is the closing message to rehearse before presenting the research:
We are not here to celebrate a gain. We are here to inspect the process behind the gain. The Amazon position has been strong, but strength does not remove the need for risk discipline. We built a custom engine, organized twenty timing strategies, reviewed the records, and separated research evidence from recommendation language.
The correct conclusion is not that an agent should trade for us. The correct conclusion is that agents can help us document assumptions, run repeatable tests, compare strategy behavior, expose weak logic, and prepare better conversations with risk, technology, and governance teams. Human judgment remains the final control.
Final Governance Checklist
Confirm the workflow is education and planning support, not investment advice.
Confirm the position language is long-only and avoids derivative implementation.
Confirm whether results are real-data backtests or offline demo outputs.
Confirm each strategy has a trade ledger, equity curve, drawdown path, and performance summary.
Confirm code, data, parameters, and charts are versioned together.
Confirm the investment committee understands limitations before discussing any allocation decision.