
Workshop Series
- Workshop 1: Build with Kiro: Prompt-First Product Design for a Tagalog Learning App
- Workshop 2: Build with Kiro: Educational-First Dev Tips for a Tagalog Learning App
- Workshop 3: Build with Kiro: Deep-Dive Development Flow for a Tagalog Learning App
- Workshop 4: Build with Kiro: Localize a Tagalog Learning App into Chinese Variants Workshop
- Workshop 5: Build with Kiro: Grammar and Pronunciation Enrichment Pipeline for Tagalog Cards Workshop
- Workshop 6: Build with Kiro: Unique and Reviewable Extra Examples in a Tagalog Learning App Workshop
- Workshop 7: Build with Kiro: Rebuild the CME Direct-Style Quant P&L Leaderboard UI
- Workshop 8: Build with Kiro: Recreate the Quant Analytics Engine Behind the P&L Board
- Workshop 9: Build with Kiro: AWS AI-Powered Trading Desk Assistant for the Quant Board
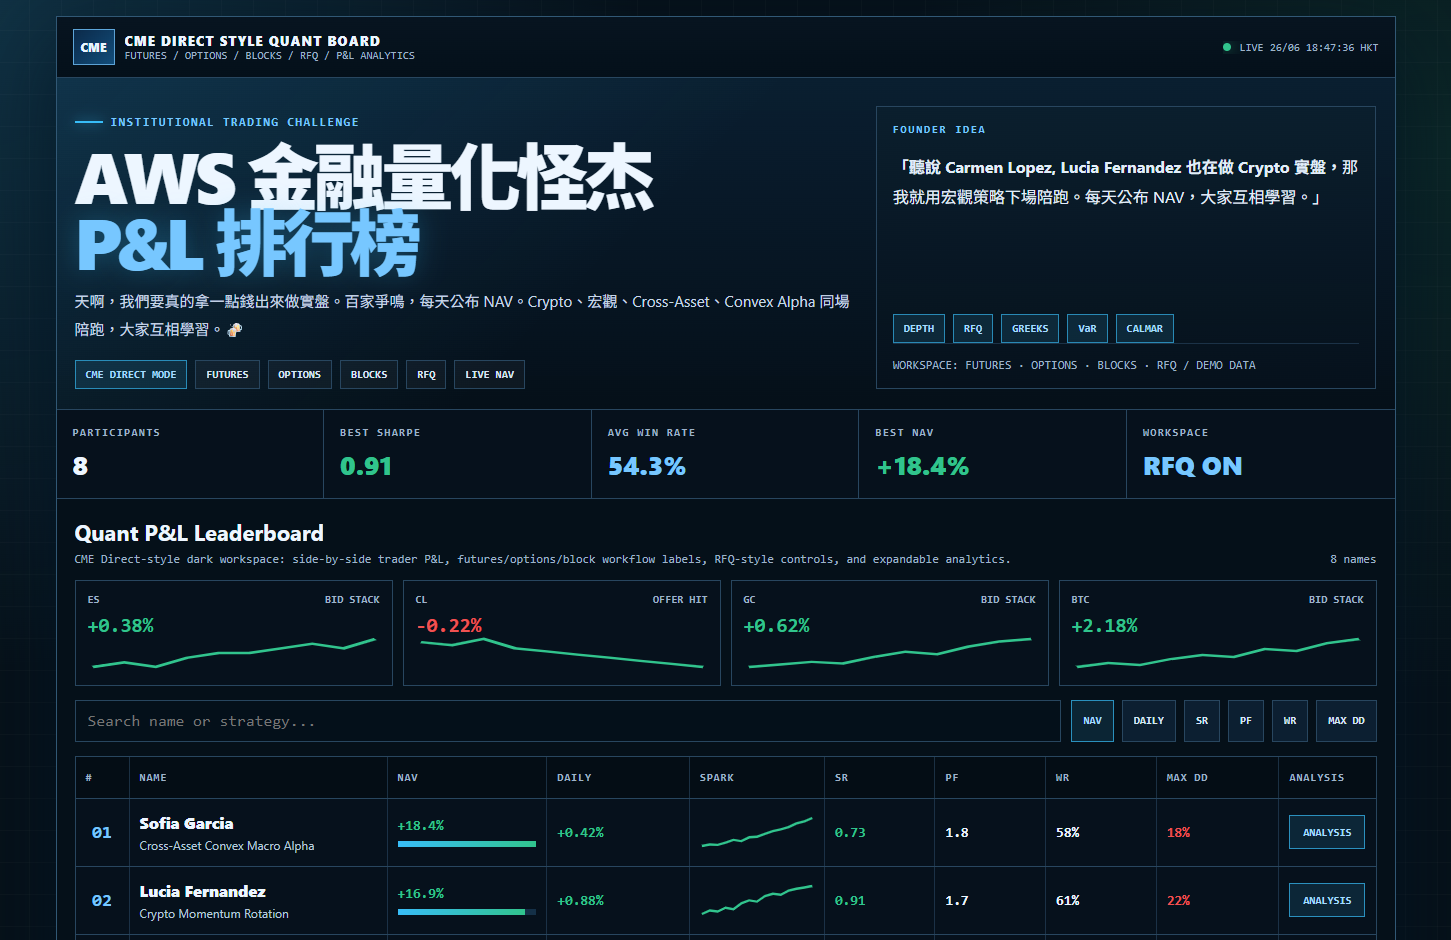
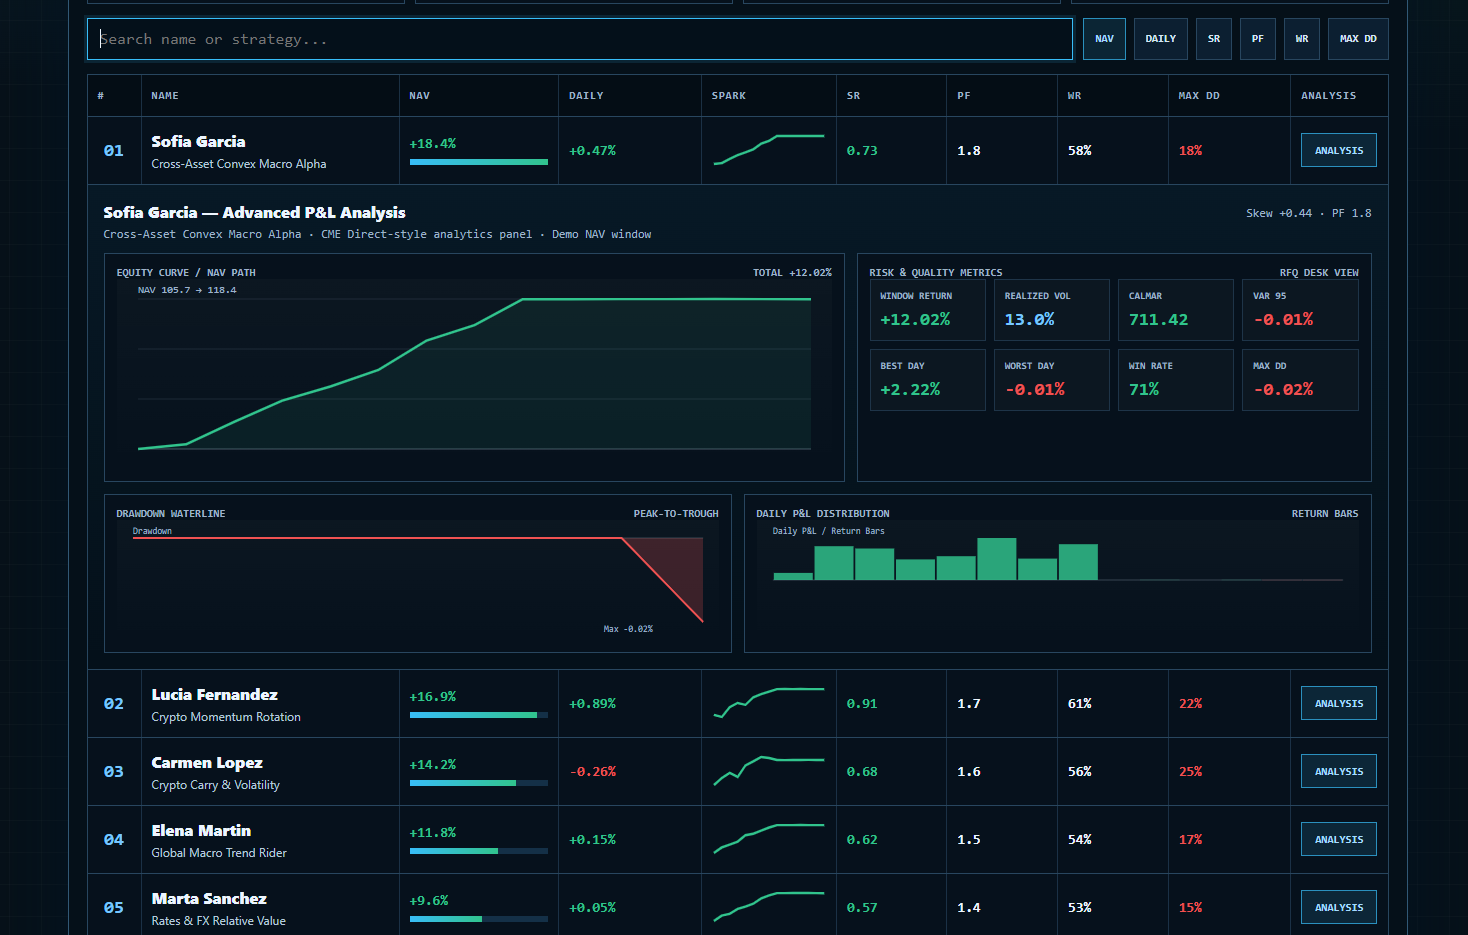
Summary: This standalone workshop teaches developers to rebuild the quantitative JavaScript logic from the uploaded leaderboard using Kiro, TypeScript, pure financial functions, SVG chart generators, tests, and controlled live simulation. Developers implement return, drawdown, volatility, Calmar, VaR, best day, worst day, win rate, sorting, search filtering, sparkline paths, equity curves, histograms, and update-loop safety with complete prototype coverage and review tasks.
Workshop purpose
This 2-hour workshop focuses on the analytics and interaction engine behind the demo. Instead of emphasizing UI styling, it extracts the original JavaScript behavior into testable TypeScript modules. Developers learn how to use Kiro to design financial functions, test edge cases, explain metric meaning, and preserve live-update behavior without introducing unreliable calculations.
Demo coverage map
This workshop covers these demo implementation details:
- Participant array
Pwith 8 traders, strategies, NAV %, daily %, Sharpe, profit factor, win rate, skew, Max DD, and NAV series. - Market array
Mwith ES, CL, GC, BTC, state labels, movement values, and mini-series. - Formatting helpers: signed percentage display and positive/negative class selection.
ret(series): daily return series.dd(series): drawdown series.avg,sd,perc: mean, standard deviation, percentile.path: SVG polyline path generation.spark,eqChart,ddChart,hist: mini and full chart generation concepts.panel: derived advanced metrics, including window return, realized volatility, Calmar, VaR 95, best day, worst day, win rate, Max DD.data: search and sort behavior.render: row building and open-panel preservation.stat: participant count, best Sharpe, average win rate, best NAV.- Five-second simulated NAV and daily return update loop.
Target developers
- Quant developers converting dashboard math into tested modules.
- TypeScript developers learning financial metric implementation.
- Frontend developers who need deterministic chart path generation.
- Engineers learning how Kiro can review math and edge cases.
Two-hour agenda
| Time | Module | Developer output |
|---|---|---|
| 0:00-0:10 | Extract requirements | analytics inventory from HTML demo |
| 0:10-0:25 | Kiro steering | metric sign, units, test, and simulation rules |
| 0:25-0:45 | Metric engine | return, drawdown, volatility, percentile, Calmar |
| 0:45-1:05 | Aggregation engine | leaderboard stats and sort/filter logic |
| 1:05-1:25 | SVG chart engine | sparkline, equity curve, drawdown, histogram paths |
| 1:25-1:45 | Live simulation | controlled update loop and state safety |
| 1:45-1:55 | Tests | unit and property-based tests |
| 1:55-2:00 | Kiro review | edge-case and production-hardening backlog |
Architecture
src/domain/
├─ types.ts              # Trader, Market, RiskMetrics, SortKey
├─ formatting.ts         # signed percentages and classes
├─ calculations.ts       # returns, drawdown, volatility, percentile
├─ leaderboard.ts        # search, sort, stats, row models
├─ charts.ts             # SVG path and chart model functions
├─ simulator.ts          # deterministic update loop helpers
└─ __tests__/
   ├─ calculations.test.ts
   ├─ leaderboard.test.ts
   ├─ charts.test.ts
   └─ simulator.test.ts
Financial metric definitions and trading-decision usage
| Metric | Demo formula or interpretation | Trading decision usage |
|---|---|---|
| Window Return | (last NAV / first NAV - 1) * 100. |
Measures cumulative performance over the displayed window. |
| Daily Return | (today NAV / previous NAV - 1) * 100. |
Shows short-term contribution and drives histogram bars. |
| Realized Volatility | Standard deviation of daily returns multiplied by sqrt(252). |
Used to compare risk intensity across strategies. |
| Drawdown | (current NAV / running peak - 1) * 100. |
Detects how far a strategy is below its peak. |
| Max Drawdown | Minimum drawdown over the series. | Used for risk limit and stop-review thresholds. |
| Calmar Ratio | Window return divided by absolute Max Drawdown. | Compares return efficiency versus capital pain. |
| VaR 95 | Fifth percentile of daily returns in the simplified demo. | Approximates downside threshold under historical returns. |
| Best Day | Maximum daily return. | Identifies upside jump potential. |
| Worst Day | Minimum daily return. | Identifies single-period downside shock. |
| Win Rate | Positive daily returns divided by total returns. | Measures consistency but not trade size. |
| Profit Factor | Demo row quality metric from participant data. | Compares gross gains to losses as a strategy-quality indicator. |
| Skew | Demo row asymmetry indicator. | Negative skew warns about downside tail behavior. |
Step 1 — Add Kiro steering for financial calculations
Create .kiro/steering/quant-math.md:
# Quant math steering

- Treat all displayed returns as percentage points, not decimals.
- Drawdown must be zero or negative.
- VaR 95 is the fifth percentile of daily returns for this demo.
- Realized volatility uses sqrt(252) annualization.
- Keep all financial functions pure and side-effect free.
- Do not invent live or real market data.
Create .kiro/steering/testing.md:
# Testing steering

Every financial formula needs deterministic unit tests.
Use property-style tests for invariants such as drawdown <= 0.
Test empty arrays, one-point arrays, flat NAV, all-winner NAV, all-loser NAV, invalid NAV, and extreme drawdown.
Prompt sample for Kiro
Create a spec for extracting the uploaded leaderboard JavaScript into TypeScript analytics modules. Include financial formula definitions, sort and search behavior, SVG path generation, live simulation behavior, tests, and edge cases.
Business logic: The steering defines financial meaning before code generation. Developers need consistent units and sign conventions to avoid misleading rankings.
Code logic: Kiro uses the steering rules to generate pure functions and tests rather than embedding calculations inside UI rendering.
Expected result: Kiro produces a requirements/design/tasks flow for the analytics engine.
System design rationale:
- Quant math steering is mandatory because the original prototype includes short helper names such as
ret,dd, andperc; production developers need explicit meaning. - Testing steering is separated from math steering because test coverage is an engineering policy, not a financial formula.
- The “no live data invention†rule keeps the workshop honest. Simulated data can be used only when clearly labeled as demo behavior.
Step 2 — Define types
Create src/domain/types.ts:
export type SortKey = 'navPct' | 'dailyPct' | 'sharpe' | 'profitFactor' | 'winRatePct' | 'maxDrawdownPct';

export type Trader = {
    name: string;
    strategy: string;
    navPct: number;
    dailyPct: number;
    sharpe: number;
    profitFactor: number;
    winRatePct: number;
    skew: number;
    maxDrawdownPct: number;
    series: number[];
};

export type AdvancedMetrics = {
    windowReturnPct: number;
    realizedVolPct: number;
    calmarRatio: number;
    valueAtRisk95Pct: number;
    bestDayPct: number;
    worstDayPct: number;
    winRatePct: number;
    maxDrawdownPct: number;
};
Business logic: Types document which values are raw input and which are derived analytics.
Code logic: SortKey models the demo’s sort buttons. Trader mirrors the participant object and AdvancedMetrics mirrors the detail panel boxes.
Expected result: TypeScript catches invalid sort keys or missing metric fields during development.
System design rationale:
- Explicit types replace implicit JavaScript object shapes. This is crucial because trading dashboards frequently evolve by adding fields.
- Sort keys use domain names instead of UI labels like
SRorPF, making code easier to understand while preserving labels at the presentation layer. - Advanced metrics are separated from trader input because values such as Calmar and VaR are computed from
series, not manually maintained.
Step 3 — Implement calculations
Create src/domain/calculations.ts:
import type { AdvancedMetrics } from './types';

export function returnsPct(series: number[]): number[] {
    if (series.length < 2) return [];
    return series.slice(1).map((value, index) => ((value / series[index]) - 1) * 100);
}

export function drawdownPct(series: number[]): number[] {
    if (!series.length) return [];
    let peak = series[0];
    return series.map(value => {
        peak = Math.max(peak, value);
        return peak === 0 ? 0 : ((value / peak) - 1) * 100;
    });
}

export function average(values: number[]): number {
    return values.length ? values.reduce((a, b) => a + b, 0) / values.length : 0;
}

export function standardDeviation(values: number[]): number {
    const m = average(values);
    return values.length ? Math.sqrt(average(values.map(v => (v - m) ** 2))) : 0;
}

export function percentile(values: number[], p: number): number {
    if (!values.length) return 0;
    const sorted = [...values].sort((a, b) => a - b);
    const index = Math.min(sorted.length - 1, Math.max(0, Math.floor((p / 100) * sorted.length)));
    return sorted[index];
}

export function advancedMetrics(series: number[]): AdvancedMetrics {
    const r = returnsPct(series);
    const d = drawdownPct(series);
    const windowReturnPct = series.length >= 2 ? ((series.at(-1)! / series[0]) - 1) * 100 : 0;
    const maxDrawdownPct = d.length ? Math.min(...d) : 0;
    return {
        windowReturnPct,
        realizedVolPct: standardDeviation(r) * Math.sqrt(252),
        calmarRatio: maxDrawdownPct === 0 ? 0 : windowReturnPct / Math.abs(maxDrawdownPct),
        valueAtRisk95Pct: percentile(r, 5),
        bestDayPct: r.length ? Math.max(...r) : 0,
        worstDayPct: r.length ? Math.min(...r) : 0,
        winRatePct: r.length ? r.filter(x => x > 0).length / r.length * 100 : 0,
        maxDrawdownPct,
    };
}
Business logic: These functions reproduce the analytics panel logic using professional names and safe empty-array behavior.
Code logic: The code converts the prototype helpers into composable functions. advancedMetrics aggregates the specific box values shown in the detail panel.
Expected result: Passing Sofia's NAV series returns a window return around 18.4%, a negative Max DD, and advanced analytics values for the panel.
System design rationale:
- Pure functions make the analytics engine usable from UI, API, tests, or batch jobs. This protects business logic from UI refactors.
advancedMetricscentralizes panel calculations so the React detail panel does not duplicate formulas.- The percentile method intentionally mirrors the original simplified demo. The workshop should explain that production VaR requires stronger methodology and data governance.
Step 4 — Implement sorting, filtering, and summary stats
Create src/domain/leaderboard.ts:
import type { SortKey, Trader } from './types';

export function signed(value: number, digits = 1, suffix = ''): string {
    return `${value >= 0 ? '+' : ''}${value.toFixed(digits)}${suffix}`;
}

export function searchAndSort(traders: Trader[], query: string, sortKey: SortKey): Trader[] {
    const q = query.trim().toLowerCase();
    return traders
        .filter(t => !q || t.name.toLowerCase().includes(q) || t.strategy.toLowerCase().includes(q))
        .sort((a, b) => sortKey === 'maxDrawdownPct' ? a.maxDrawdownPct - b.maxDrawdownPct : b[sortKey] - a[sortKey]);
}

export function boardStats(traders: Trader[]) {
    return {
        participants: traders.length,
        bestSharpe: Math.max(...traders.map(t => t.sharpe)),
        avgWinRatePct: traders.reduce((s, t) => s + t.winRatePct, 0) / traders.length,
        bestNavPct: Math.max(...traders.map(t => t.navPct)),
    };
}
Business logic: Users can rank by performance or quality and search by person or strategy. Summary stats support a fast desk-level read.
Code logic: The function reproduces the demo’s data() and stat() behavior. Max Drawdown sorts ascending because lower drawdown is better in the original logic.
Expected result: Sorting by NAV puts Sofia first. Searching crypto returns Lucia Fernandez and Carmen Lopez.
System design rationale:
- Sorting is extracted from rendering so tests can prove ranking behavior independent of UI.
- Search uses both name and strategy because the original demo lets users discover traders by strategy style, not just person.
- Max Drawdown sort is special-cased because risk metrics often have opposite directionality from return metrics.
Step 5 — Implement SVG path helpers
Create src/domain/charts.ts:
export function svgPath(values: number[], width: number, height: number, padding = 18): string {
    if (!values.length) return '';
    const min = Math.min(...values);
    const max = Math.max(...values);
    const range = max - min || 1;
    const innerWidth = width - padding * 2;
    const innerHeight = height - padding * 2;
    return values.map((value, index) => {
        const x = padding + index * innerWidth / Math.max(1, values.length - 1);
        const y = padding + innerHeight - ((value - min) / range) * innerHeight;
        return `${index ? 'L' : 'M'}${x.toFixed(1)} ${y.toFixed(1)}`;
    }).join(' ');
}

export function histogramBars(returns: number[], width: number, height: number, padding = 18) {
    const maxAbs = Math.max(...returns.map(Math.abs), 1);
    const barWidth = (width - padding * 2) / Math.max(1, returns.length);
    const mid = height / 2;
    return returns.map((value, index) => {
        const barHeight = Math.abs(value) / maxAbs * (height / 2 - padding);
        return {
            x: padding + index * barWidth + 1,
            y: value >= 0 ? mid - barHeight : mid,
            width: Math.max(2, barWidth - 2),
            height: barHeight,
            positive: value >= 0,
        };
    });
}
Business logic: Charts help traders understand trend, drawdown pressure, and daily return distribution faster than numbers alone.
Code logic: svgPath mirrors the prototype path generator. histogramBars converts returns into rectangle geometry for positive/negative bars.
Expected result: The same NAV series can generate a sparkline, equity curve, drawdown line, and return histogram.
System design rationale:
- Chart geometry is calculated in pure functions so it can be tested without browser rendering.
- The path function normalizes values to a view box. This allows the same helper to power small sparklines and larger charts.
- Histogram bars carry a
positiveflag so the UI can apply green or red styling without recalculating sign logic.
Step 6 — Implement controlled live simulation
Create src/domain/simulator.ts:
import type { Trader } from './types';

export function nextDemoTick(traders: Trader[], random = Math.random): Trader[] {
    return traders.map(trader => {
        const bump = (random() - 0.48) * 0.18;
        const nextDailyPct = Number((trader.dailyPct + bump).toFixed(2));
        const nextNavPct = Number((trader.navPct + bump * 0.25).toFixed(2));
        return {
            ...trader,
            dailyPct: nextDailyPct,
            navPct: nextNavPct,
            series: [...trader.series.slice(1), 100 + nextNavPct],
        };
    });
}
Business logic: The demo updates every five seconds to simulate a live board. Developers must clearly label this as simulated, not market data.
Code logic: The function mirrors the original update loop but makes randomness injectable for deterministic tests.
Expected result: Each tick adjusts daily return, adjusts NAV slightly, shifts the series window, and appends a new synthetic NAV point.
System design rationale:
- Randomness is injected because tests need deterministic behavior. This keeps the live demo feel without making tests flaky.
- The series uses a rolling window by dropping the oldest point. This preserves chart length and avoids unbounded memory growth.
- The function returns new objects rather than mutating the original array, matching React state management expectations.
Step 7 — Add tests
Create src/domain/__tests__/calculations.test.ts:
import { describe, expect, it } from 'vitest';
import { advancedMetrics, drawdownPct, returnsPct } from '../calculations';

describe('quant calculations', () => {
    it('calculates returns from NAV', () => {
        expect(returnsPct([100, 110, 99]).map(x => Number(x.toFixed(2)))).toEqual([10, -10]);
    });

    it('drawdown is never positive', () => {
        expect(drawdownPct([100, 120, 90, 130]).every(x => x <= 0)).toBe(true);
    });

    it('creates advanced panel metrics', () => {
        const metrics = advancedMetrics([100, 105, 99.75]);
        expect(Number(metrics.windowReturnPct.toFixed(2))).toBe(-0.25);
        expect(Number(metrics.maxDrawdownPct.toFixed(2))).toBe(-5.00);
    });
});
Prompt sample for Kiro
Review the analytics modules and tests. Add test cases for every demo participant series, sort behavior for NAV and Max DD, search by strategy, SVG path boundaries, histogram positive/negative bars, and deterministic simulation with injected random values.
Business logic: Tests protect calculations that drive trading interpretation.
Code logic: Unit tests validate known numeric examples and can be expanded to cover all participants.
Expected result: npx vitest run passes and Kiro proposes additional coverage.
System design rationale:
- Known-value tests catch formula regressions quickly. They are easy for finance reviewers to understand.
- Kiro is asked to add participant-specific regression tests so changes to data or formulas do not unexpectedly change displayed analytics.
- Chart tests focus on geometry boundaries because SVG visual tests are expensive and unnecessary for this workshop.
Final lab challenge
Ask Kiro:
Generate a complete analytics gap report comparing the TypeScript modules against the original demo JavaScript functions: sg, cl, id, ret, dd, avg, sd, perc, path, spark, eqChart, ddChart, hist, panel, data, render, tog, stat, markets, clock, and the five-second update loop. Identify what is implemented, what is intentionally moved to React, and what still needs tests.
Completion checklist
- All participant and market data are typed.
- Returns, drawdown, volatility, percentile, Calmar, VaR, best/worst day, and win rate are implemented.
- Search and sort reproduce demo behavior.
- SVG path and histogram geometry are pure functions.
- Live simulation is clearly labeled and deterministic in tests.
- Kiro has reviewed math edge cases.
- Tests cover calculation, sorting, charts, and simulation.
Appendix — complete participant and market coverage for analytics tests
Use this checklist to ensure the analytics engine covers the full HTML demo, not only sample rows:
- Sofia Garcia — Cross-Asset Convex Macro Alpha: NAV +18.4%, Daily +0.42%, SR 0.73, PF 1.8, WR 58%, Skew +0.44, Max DD 18.
- Lucia Fernandez — Crypto Momentum Rotation: NAV +16.9%, Daily +0.88%, SR 0.91, PF 1.7, WR 61%, Skew +0.31, Max DD 22.
- Carmen Lopez — Crypto Carry & Volatility: NAV +14.2%, Daily -0.31%, SR 0.68, PF 1.6, WR 56%, Skew +0.22, Max DD 25.
- Elena Martin — Global Macro Trend Rider: NAV +11.8%, Daily +0.17%, SR 0.62, PF 1.5, WR 54%, Skew +0.18, Max DD 17.
- Marta Sanchez — Rates & FX Relative Value: NAV +9.6%, Daily +0.09%, SR 0.57, PF 1.4, WR 53%, Skew +0.09, Max DD 15.
- Paula Romero — Equity Factor Ensemble: NAV +7.1%, Daily -0.12%, SR 0.49, PF 1.3, WR 52%, Skew -0.04, Max DD 14.
- Ana Torres — Commodity Breakout System: NAV +5.4%, Daily +0.28%, SR 0.42, PF 1.2, WR 51%, Skew +0.12, Max DD 19.
- Laura Navarro — Multi-Asset Mean Reversion: NAV +3.8%, Daily -0.06%, SR 0.35, PF 1.1, WR 49%, Skew -0.11, Max DD 16.
Market tile regression cases:
- ES: +0.38%,
BID STACK, series[20,21,20,22,23,23,24,25,24,26]. - CL: -0.22%,
OFFER HIT, series[30,29,31,28,27,26,25,24,23,22]. - GC: +0.62%,
BID STACK, series[18,18.5,19,18.7,20,21,20.5,22,23,23.5]. - BTC: +2.18%,
BID STACK, series[20,22,21,24,26,25,29,28,32,34].
Kiro prompt for full coverage:
Generate a regression test suite that loads all 8 participant rows and all 4 market tiles. Validate summary stats, sort order for every sort key, search by each strategy keyword, SVG paths for each series, and advanced panel metrics for every participant.
Source demo reference
This workshop is based on the uploaded aws_quant_pnl_leaderboard_v3.html demo. The demo includes a CME Direct-style dark workspace, participant leaderboard, market cards, sortable/searchable P&L board, advanced analytics panels, chart functions, responsive CSS, live HKT clock, and simulated periodic NAV updates. All data is treated as demo placeholder data and not investment advice.
Additional Hands-on Developer Labs for Advanced Developers — HTML Graphic Analysis
These labs extend the quant analytics workshop by analyzing the uploaded HTML file's SVG chart graphics. They focus on how the prototype turns NAV series, drawdown arrays, and daily returns into visual marks. They do not repeat the base financial formulas or the UI component migration.
Advanced graphic-analysis goals
By the end of this section, advanced developers will be able to:
- Explain how the HTML converts numeric series into SVG paths, areas, lines, and bars.
- Validate chart geometry with deterministic tests.
- Separate visual encoding logic from financial calculations.
- Build chart-audit metadata that helps reviewers understand graphic meaning.
- Detect misleading chart output caused by scale, padding, or edge-case data.
Chart graphics inventory from the HTML file
The uploaded HTML uses several JavaScript functions to produce SVG graphics:
path(a,w,h,p)normalizes a sequence into SVGMandLcommands.spark(a)renders compact row and market-card sparklines.grid(w,h,p)creates horizontal grid lines and a bottom axis.eqChart(a)renders an equity curve with filled area and NAV start/end label.ddChart(a)renders drawdown as a red waterline shape below a zero axis.hist(a)renders daily return bars around a midline, using separate positive and negative classes.
Advanced Lab 1 — Chart geometry contract tests
Objective: Create tests that prove SVG geometry stays inside chart bounds and handles flat, short, and volatile series safely.
Create src/domain/__tests__/chartGeometry.test.ts:
import { describe, expect, it } from 'vitest';
import { svgPath, histogramBars } from '../charts';

function extractNumbers(path: string): number[] {
  return path.match(/-?\d+(\.\d+)?/g)?.map(Number) ?? [];
}

describe('SVG chart geometry contracts', () => {
  it('keeps path coordinates inside the viewbox padding boundaries', () => {
    const d = svgPath([100, 102, 101, 104], 120, 32, 2);
    const numbers = extractNumbers(d);
    const xs = numbers.filter((_, index) => index % 2 === 0);
    const ys = numbers.filter((_, index) => index % 2 === 1);

    expect(Math.min(...xs)).toBeGreaterThanOrEqual(2);
    expect(Math.max(...xs)).toBeLessThanOrEqual(118);
    expect(Math.min(...ys)).toBeGreaterThanOrEqual(2);
    expect(Math.max(...ys)).toBeLessThanOrEqual(30);
  });

  it('renders flat series without division-by-zero geometry failures', () => {
    const d = svgPath([100, 100, 100], 120, 32, 2);
    expect(d).toContain('M');
    expect(d).toContain('L');
    expect(d).not.toContain('NaN');
    expect(d).not.toContain('Infinity');
  });

  it('creates positive and negative histogram bars around a midline', () => {
    const bars = histogramBars([1, -2, 0.5], 680, 120, 18);
    expect(bars.some((bar) => bar.positive)).toBe(true);
    expect(bars.some((bar) => !bar.positive)).toBe(true);
  });
});
Kiro prompt:
Generate chart geometry tests for the uploaded HTML's path, sparkline, equity curve, drawdown, and histogram behavior. Verify coordinate bounds, no NaN or Infinity, flat series behavior, short series behavior, positive/negative histogram flags, and drawing consistency across demo participant series.
Expected result: Developers can refactor chart code without accidentally producing broken SVG.
Advanced Lab 2 — SVG visual encoding documentation
Objective: Document the relationship between financial concepts and graphic marks so chart behavior is reviewable.
Create docs/svg-visual-encoding.md:
# SVG Visual Encoding Notes

## Sparkline

- Data input: NAV series or market mini-series.
- Mark type: single green line.
- Purpose: compact trend preview.
- Risk: no y-axis scale shown, so it should not be treated as precise measurement.

## Equity curve

- Data input: indexed NAV series.
- Mark type: green line plus translucent filled area.
- Purpose: visible cumulative performance path.
- Label: first NAV value and last NAV value.

## Drawdown waterline

- Data input: drawdown percentage series derived from NAV.
- Mark type: red line and red filled area below zero axis.
- Purpose: show peak-to-trough pain and recovery pressure.

## Daily P&L histogram

- Data input: daily return series.
- Mark type: vertical bars around a horizontal midline.
- Positive encoding: green bar above midline.
- Negative encoding: red bar below midline.
Kiro prompt:
Create visual encoding documentation for the HTML charts. Explain sparkline, equity curve, drawdown waterline, and daily P&L histogram using data input, SVG mark type, color encoding, scale limitations, and reviewer cautions.
Expected result: Chart graphics become explainable to developers, designers, and risk reviewers.
Advanced Lab 3 — Chart-audit metadata generator
Objective: Generate metadata for each chart so reviewers can inspect scale, min/max, range, positive/negative bar counts, and label text.
Create src/domain/chartAudit.ts:
import { drawdownPct, returnsPct } from './calculations';

export type SeriesAudit = {
  pointCount: number;
  min: number;
  max: number;
  range: number;
  first: number;
  last: number;
};

export type ChartAudit = {
  nav: SeriesAudit;
  drawdown: SeriesAudit;
  returns: SeriesAudit & {
    positiveCount: number;
    negativeCount: number;
    zeroCount: number;
  };
};

function auditSeries(values: number[]): SeriesAudit {
  if (!values.length) {
    return { pointCount: 0, min: 0, max: 0, range: 0, first: 0, last: 0 };
  }

  const min = Math.min(...values);
  const max = Math.max(...values);

  return {
    pointCount: values.length,
    min,
    max,
    range: max - min,
    first: values[0],
    last: values.at(-1)!,
  };
}

export function auditChartSeries(navSeries: number[]): ChartAudit {
  const drawdown = drawdownPct(navSeries);
  const returns = returnsPct(navSeries);
  const returnsAudit = auditSeries(returns);

  return {
    nav: auditSeries(navSeries),
    drawdown: auditSeries(drawdown),
    returns: {
      ...returnsAudit,
      positiveCount: returns.filter((value) => value > 0).length,
      negativeCount: returns.filter((value) => value < 0).length,
      zeroCount: returns.filter((value) => value === 0).length,
    },
  };
}
Kiro prompt:
Add chart-audit metadata for every NAV series. Include point count, min, max, range, first/last values, drawdown range, return range, and positive/negative/zero return counts. Add tests for all eight participant series.
Expected result: Analytics reviewers can inspect chart inputs and scale risks without opening the browser.
Advanced Lab 4 — Misleading-graphic edge-case lab
Objective: Teach developers to identify edge cases where a graphic can be technically correct but visually misleading.
Create docs/misleading-chart-edge-cases.md:
# Misleading Chart Edge Cases

## Flat series

A flat NAV series produces a line, but the visual range fallback can make tiny movements appear larger than they are if the label is ignored.

## Single-point series

A single point cannot represent a trend. The chart should render a safe placeholder or show an insufficient-data message.

## Extreme outlier

One large jump can compress all other variation, making normal volatility look invisible.

## Short return window

A 14-return histogram is educational but not enough for robust distribution conclusions.

## Missing scale labels

Sparklines are useful for quick shape recognition but should not be used as precise risk evidence.
Kiro prompt:
Create a misleading-graphic edge-case guide for the HTML chart functions. Cover flat series, one-point series, extreme outliers, short return windows, missing y-axis scale, and histogram interpretation limits.
Advanced Lab 5 — Chart rendering acceptance criteria
Objective: Define acceptance criteria for chart graphics before production refactor acceptance.
Create docs/chart-rendering-acceptance-criteria.md:
# Chart Rendering Acceptance Criteria

## Equity curve

- Uses the same normalized coordinate logic as the HTML prototype.
- Includes visible line and filled area.
- Labels first and final NAV values.
- Does not render NaN or Infinity.

## Drawdown waterline

- Drawdown values are zero or negative before rendering.
- Zero axis is visible.
- Red area grows downward as drawdown deepens.
- Max drawdown label matches calculated minimum drawdown.

## Daily return histogram

- Positive bars appear above the midline.
- Negative bars appear below the midline.
- Zero bars do not create visual errors.
- Bar width remains visible at all supported chart sizes.

## Sparkline

- Compact chart does not include unsupported scale claims.
- Preserves trend shape for all participant and market mini-series.
Kiro prompt:
Generate chart rendering acceptance criteria for React/SVG refactoring. Include equity curve, drawdown waterline, daily return histogram, and sparkline checks. Tie every visual assertion to a deterministic test where possible.
Advanced final challenge — SVG chart fidelity review
Ask Kiro:
Perform an SVG chart fidelity review against the uploaded HTML file. Compare path normalization, padding, equity area closure, grid lines, drawdown zero axis, histogram midline, positive/negative bar placement, labels, and edge-case behavior. Produce a prioritized remediation backlog.
Advanced graphic-analysis completion checklist
- Chart geometry tests verify bounds and invalid-number protection.
- Visual encoding documentation explains every SVG chart type.
- Chart-audit metadata summarizes NAV, drawdown, and return series.
- Misleading-graphic edge cases are documented.
- Rendering acceptance criteria protect chart refactors.